Technical Indicators and Their Types (Complete Guide for Traders)
Introduction
If you want to become a successful trader, you must understand price action and technical indicators. Traders use different approaches—some rely only on price action, some use technical indicators, and many combine both to make better trading decisions.
Technical indicators help traders analyze past price and volume data to forecast future market movements. In this article, you’ll learn:
- What technical indicators are
- Why traders use technical indicators
- The main types of technical indicators with examples
What Are Technical Indicators?
Technical indicators are mathematical calculations based on a stock’s price, volume, or volatility. Traders use them along with price charts to identify trends, momentum, volatility, and potential buy or sell signals.
These indicators analyze historical market data to help predict future price movement. Compared to pure price action, technical indicators provide confirmation and clarity, especially for beginners.
Benefits of Technical Indicators
Technical indicators help traders to:
- Identify market trends (uptrend, downtrend, sideways)
- Confirm breakouts and reversals
- Generate buy and sell signals
- Measure momentum and volatility
- Improve risk management and stop-loss placement
Types of Technical Indicators
Technical indicators are broadly classified into four main categories:
- Trend Indicators
- Momentum Indicators
- Volatility Indicators
- Volume Indicators
1. Trend Indicators
Trend indicators help traders identify and confirm the direction of the market—whether it is trending upward, downward, or moving sideways. They are mainly used for trend-following strategies.
a) Moving Averages (MA)
Moving averages smooth price data to create a single flowing line, making trends easier to identify. They usually give signals after a trend or reversal has started.
- Price above MA → Bullish trend
- Price below MA → Bearish trend
Types of Moving Averages
1. Simple Moving Average (SMA)
- Calculates the average price over a fixed period
- Common periods: 50-day, 100-day, 200-day
2. Exponential Moving Average (EMA)
- Gives more weight to recent prices
- Reacts faster than SMA
- Common periods: 20, 50, 100, 200
Golden Cross: 50-day MA crosses above 200-day MA (Bullish)
Death Cross: 50-day MA crosses below 200-day MA (Bearish)
b) Moving Average Convergence Divergence (MACD)
MACD is a powerful trend-following and momentum indicator that uses two EMAs.
MACD Components:
- MACD Line = 12-EMA − 26-EMA
- Signal Line = 9-EMA of MACD
- Histogram = MACD Line − Signal Line
MACD Signals:
- MACD crosses above Signal Line → Buy signal
- MACD crosses below Signal Line → Sell signal
Zero Line Analysis:
- Above zero → Uptrend strengthening
- Below zero → Downtrend strengthening
Histogram:
- Expanding bars → Trend gaining strength
- Contracting bars → Trend weakening or reversing
c) Parabolic SAR (Stop and Reverse)
Parabolic SAR identifies trend direction, reversals, and trailing stop-loss levels.
- Dots below price → Uptrend (Buy signal)
- Dots above price → Downtrend (Sell signal)
- Dot flip → Possible trend reversal
Uses of Parabolic SAR:
- Trend confirmation
- Trailing stop-loss
- Exit strategy in trending markets
2. Momentum Indicators
Momentum indicators measure the speed and strength of price movement. They help identify overbought and oversold conditions and potential reversals.
a) Relative Strength Index (RSI)
RSI is one of the most popular momentum indicators. It ranges from 0 to 100 and is commonly set to 14 periods.
RSI Interpretation:
- Above 70 → Overbought (possible sell)
- Below 30 → Oversold (possible buy)
- Around 50 → Neutral
Common RSI Strategies:
- Buy when RSI crosses above 30
- Sell when RSI crosses below 70
- Combine RSI with moving averages for confirmation
b) Stochastic Oscillator
The Stochastic Oscillator compares the closing price to its price range over a specific period.
- Scale: 0 to 100
- Above 80 → Overbought
- Below 20 → Oversold
Signals:
- %K crosses above %D → Bullish
- %K crosses below %D → Bearish
Divergence Strategy:
- Bullish divergence → Possible upward reversal
- Bearish divergence → Possible downward reversal
3. Volatility Indicators
Volatility indicators measure price fluctuations over time. They help traders understand market risk and potential breakouts.
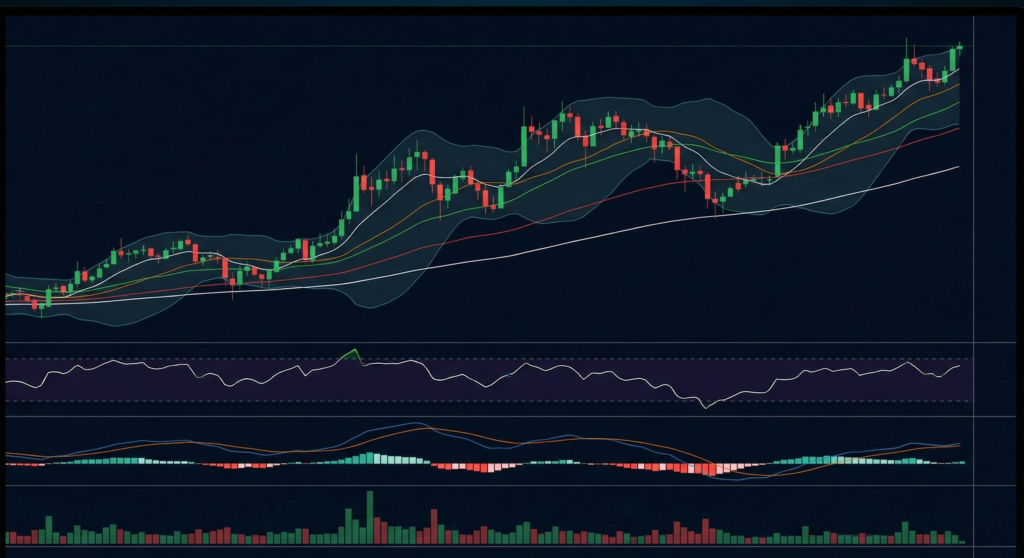
a) Bollinger Bands
Bollinger Bands consist of:
- Middle Band: 20-day SMA
- Upper & Lower Bands: Standard deviations
Key Insights:
- Price near upper band → Overbought
- Price near lower band → Oversold
- Bands widen → High volatility
- Bands contract → Low volatility
b) Average True Range (ATR)
ATR measures market volatility over a specific period (usually 14 days).
- High ATR → High volatility
- Low ATR → Low volatility
- Useful for stop-loss placement and breakout trading
- Does not indicate trend direction
4. Volume Indicators
Volume indicators measure the number of shares traded and help confirm the strength or weakness of price movements.
- High volume → Strong market participation
- Low volume → Weak interest
a) On-Balance Volume (OBV)
OBV adds volume on up days and subtracts volume on down days.
- Rising OBV → Bullish trend
- Falling OBV → Bearish trend
Divergence Signals:
- Price up, OBV flat → Weak momentum
- OBV up, price flat → Possible breakout
b) Volume Moving Average (VMA)
VMA smooths volume data over a fixed period (e.g., 20-day).
Types:
- Volume SMA
- Volume EMA
Key Insights:
- High volume above VMA during breakout → Strong signal
- Low volume breakout → Possible false move
- Declining volume → Trend weakening
Conclusion
Technical indicators play a crucial role in modern trading. When combined with price action, they help traders improve accuracy, confirm signals, and manage risk effectively. Understanding the types of technical indicators is essential for building a profitable trading strategy.