What is a Candlestick? A candlestick in the stock market is a visual representation of price changes for a stock, index, or commodity over a specific time frame. It is a widely used tool in technical analysis by traders in both Indian and global stock markets. Each candlestick represents four key price points, such as Open, High, Low, and Close. This is frequently referred to as OHLC data.
Components of a Candlestick:
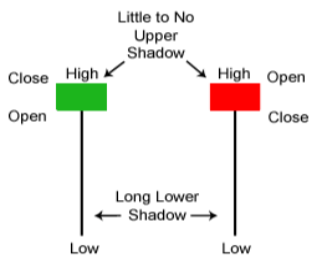
- Real Body: The thick section of the candle indicates the difference between the opening and closing prices.
- Wicks/Shadows: Narrow lines above and below the body represent the highest and lowest prices.
Types of Candlesticks:
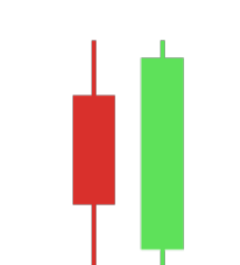
- Bullish Candlestick (Green/White): The close price is higher than the open price. This shows buying pressure.
- Bearish Candlestick (Red/Black): The close price is lower than the open price. This shows selling pressure.
Candlestick Timeframes: A candlestick can represent various time periods, such as 1 minute (for intraday trading), 5, 15, 30 minutes, 1 hour, 1 day, 1 week, or 1 month. Each candle reflects price movement for the chosen timeframe.
Why Are Candlesticks Important in Trading?
- They provide an easy way to read price movements.
- They help in recognizing market trends.
- They are useful for identifying reversal and continuation patterns.
- They are effective for intraday, swing, and long-term trading.
Here are some of the top candlestick patterns in Indian stock markets:
Here are the 5 most popular candlestick patterns used in the Indian Stock Market (NSE & BSE). These patterns are often used by intraday, swing, and positional traders, as they provide clear signals for entering and exiting trades.
- Hammer Candlestick Pattern: Basically, it appears in a downtrend as a positive reversal. The Hammer features a small body with a long, lower shadow. This indicates that sellers pushed the price down, but buyers made a strong comeback by the end. It works very well in NIFTY, BANK NIFTY, and large-cap stocks close to support levels. A small technique used while purchasing above the Hammer’s high is to set a stop-loss below the low.
- Bullish Engulfing Pattern: The pattern appears in a bullish reversal downtrend. A big green candle fully covers the last red candle, showing strong buying interest. It is commonly observed after gap-down openings and during short-covering rallies. Buy when the price goes above; the engulfing candle is more reliable with volume confirmation.

- Bearish Engulfing Pattern: The pattern appears in a bearish reversal uptrend. A big red candle covers the earlier green candle, indicating that sellers are gaining control. Taking profits by short selling in futures and options. Sell below the engulfing candle Stop-loss above the high.
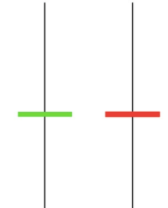
- Doji Candlestick Pattern: Doji is very important in market uncertainty or reversal and commonly appears at the top or bottom of the pattern. The opening and closing prices are nearly the same, indicating a balance between buyers and sellers. Significant near resistance levels of indices and during major news events. Most importantly, always wait for confirmation from the next candle.
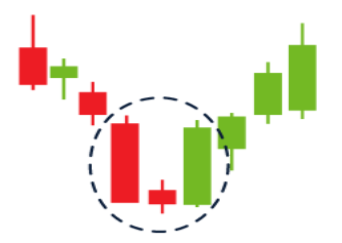
- Morning Star Pattern: This usually bullish reversal trend appears in a downtrend. A pattern of three candles, such as a strong bearish candle, a small indecision candle, and a strong bullish candle. It provides high accuracy for swing and positional trading. Buy after the third candle closes It works best on daily charts.
Explained Support and Resistance:
Introduction: Have you ever considered why prices tend to rebound from specific levels or suddenly surge past them? This phenomenon is not unexpected. These areas represent the aggregated actions of numerous traders and institutions. Commonly referred to as support and resistance levels, these zones can provide you with a significant advantage in the market. In this article, we will analyze support and resistance levels, investigate the reasons behind price reactions at these points, and analyze the ways in which perceptive traders employ them efficiently.
Support and resistance are two of the most used ideas in trading in the Indian stock markets (NSE/BSE).
What is Support? Support refers to a price point at which a stock typically stops its decline and rebounds due to increased buying interest. As the price approaches this area, many traders anticipate it to remain stable, prompting buying activity that stops further decline. This response is generally influenced by historical price patterns or significant psychological thresholds.
For example, if a stock consistently drops to ₹500 and subsequently rebounds, that ₹500 level becomes recognized as a support level. Traders monitoring this price point may place buy orders just above or at this level. If the support holds, it validates the support. Conversely, if it fails, it could signify a change in trend. Over time, support zones that are consistently respected assist traders in timing their entries more effectively.
For easy understanding, buyers think stock is cheaper at this point. So that the increase in demand and sellers reduces selling.
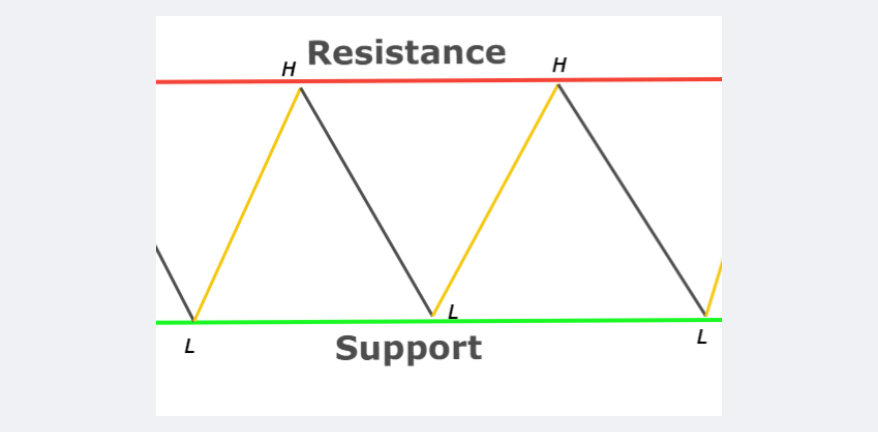
What is Resistance? In trading, resistance refers to a price point at which a stock often encounters difficulty in rising further. It functions as a “ceiling” where the interest in selling increases, frequently surpassing the demand. As prices near this threshold, many traders predict a reversal and begin to sell, which intensifies the pressure and prevents any additional upward movement. Resistance develops because of historical price actions.
For instance, if a stock has previously reached a peak of ₹1,200 and subsequently declined, traders may anticipate a similar pattern when the stock approaches that level again. This creates uncertainty, leading to a stop or decrease in price. These resistance zones are not precise figures but rather ranges where supply generally accumulates. Recognizing resistance is crucial for traders, as it aids in timing their exits, establishing stop-loss orders, or preparing for possible breakouts when prices eventually surpass that ceiling.
Describe the formation of support and resistance levels, as well as how traders utilize them.
They only work because of market psychology and trader memories. When prices reach a familiar level, market participants frequently remember how the market acted at that level in the past. This leads to a natural inclination for both buyers and sellers to position their orders around those areas.
For example, consider a stock that has declined to ₹1,000 several times but has never dropped below that point. Each time it reaches this level, buyers enter the market and identify it as a reasonable entry point. Over time, ₹1,000 was set as a significant support level. Conversely, if the same stock consistently finds it difficult to surpass ₹1,200, traders identify this threshold as resistance. The following visual illustration demonstrates how prices typically rebound near the ₹1,000 support while encountering challenges in exceeding the ₹1,200 resistance.
- Previous lows → Support
- Previous highs → Resistance
How they use it:
- Buy near Support: Keep stop-loss just below support
For example:
- Stock support at ₹300
- Buy at ₹305
- SL at ₹290
- Selling near Resistance:
- Sell or book profit near resistance
- SL just above resistance
3. Breakout and Breakdown Trading: When the price surpasses resistance accompanied by volume, the previous resistance transforms into new support. Traders engage in purchasing the breakout. Below may suggest an increase in selling pressure is breakdown trading.
- Broken support → becomes resistance
- Broken resistance → becomes support