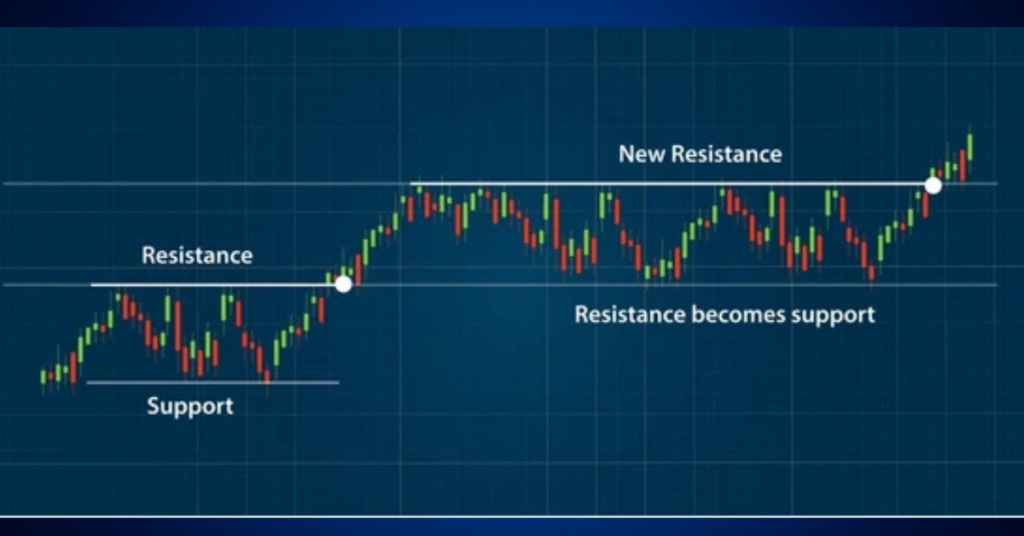
Candlestick patterns for beginners & Explained Support and Resistance
What is a Candlestick? A candlestick in the stock market is a visual representation of price changes for a stock, index, or commodity over a specific time frame. It is a widely used tool in technical analysis by traders in both Indian and global stock markets. Each candlestick represents four key price points, such as Open, High, Low, and […]